One of my favorite words to share with people when talking about horticulture lighting is gonio-spectro-photometer. It sounds like some out-of-this-world tech gadget that 99.9% of us have never heard of before. Often referred to as simply a “gonio,” this machine measures the amount and pattern of light being produced by a lighting fixture (lamp or luminaire) from different angles.
You may be shrugging your shoulders and saying, why is this important to me? In a world where data is king and everyone is tired of marketing fluff, technologies like a gonio become crucial tools of the trade. A gonio provides validation and insight as to how different lights work and what their efficacy levels are.
Let’s have a deeper look and find out how it all works. The diagram below shows the basic components of what makes up a gonio
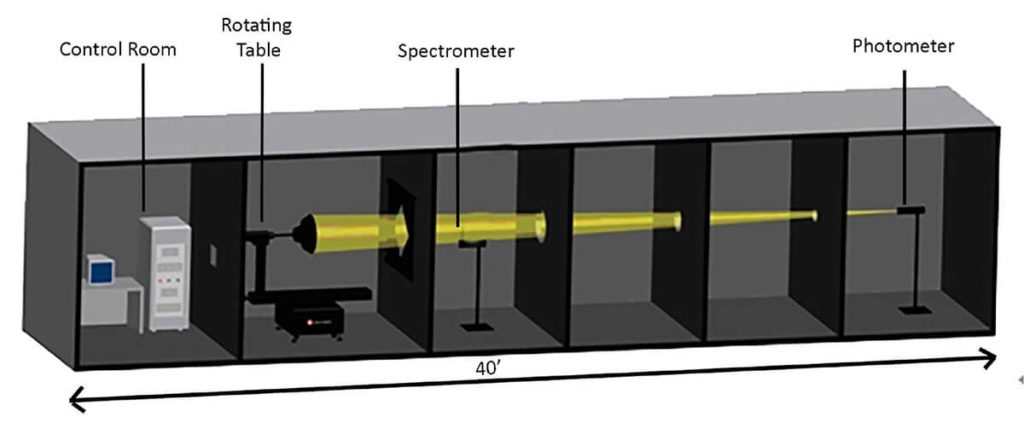
The light that is to be tested and measured is mounted on a rotating table that has a 2-axis gimbal, meaning it can rotate in 2 different planes (x and y).
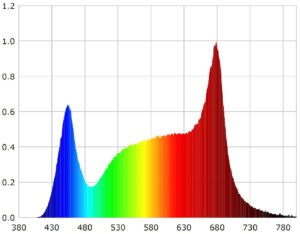
The 40 foot long measurement space is painted in a flat black color and contains multiple chambers. The first chamber has a spectrometer that measures color (as seen in the image to the right) and at the end is a photometer that measures visible light and intensity. For those of you reading this that need a better visual to really understand what we are talking about, check out this time lapse video of a 2 hour test:
After a couple of hours cycling through a full test a dedicated supercomputer crunches the thousands of data points collected and pushes it out into an IES file. An IES file is an industry standard file format for the output of light fixture data. It’s basically an electronic model of the invisible beam of light and all of its characteristics, such as: direction, intensity, etc. These IES files can then be used by engineers and architects to build computer models of what a certain light or multiple lights might look like in a given room or space.
Simulations are great and all but what else can we do we do with the data? Create PAR maps of course! PAR maps, a measurement of PPFD, are a much more accurate depiction of the amount of energy actually reaching the plants than total PPF of the light fixture. PAR maps are where the proverbial rubber meets the road.
Output patterns are another important aspect of what the gonio data can give us insight into. Why does output pattern matter you say? In our previous blog (available HERE ) we discussed how light is like water coming out of a hose. Just as the pattern of water coming out of a hose can be influenced by a nozzle, making it a jet, shower or flat spray pattern, optics control the light coming off of a lighting fixture. Without a gonio, we would never understand any of this! Looking at the patterns in the Light Distribution Curve (taken from the gonio report) the difference in emission patterns immediately becomes evident.
True lighting science requires cutting edge tools in order to quantify data and provide real-world application insights. Many lighting manufacturers only test their lights in a sphere, instead of a gonio. While this may look amazing on a spec or data sheet, they are only providing total energy. Sadly, this ignores the more important light patterns and intensities, which are all that plants care about at the end of the day. Light is a necessary and very expensive component of indoor horticulture. Giving botanists, farmers and growers the data they need to make informed decisions is imperative. At Scynce, we have a Goniospectrophotometer in-house, allowing our R&D team to test an unlimited amount to ensure that all of our lights are top quality and perform as promised.